Contents
Advanced Analytics[edit]
Power BI [edit]
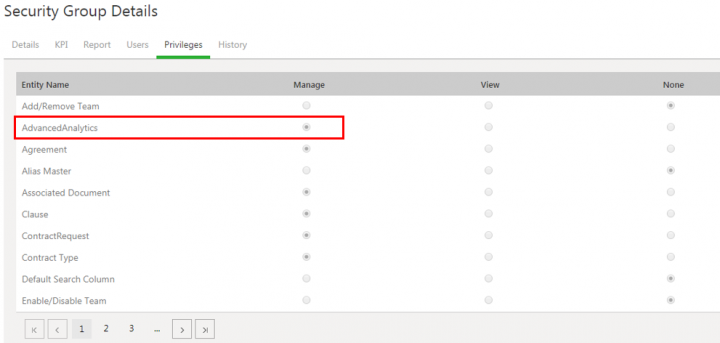
Power Business Intelligence (BI) provides real time analytics and ad-hoc report generation capabilities to the user, through a configurable option of providing the Advanced Analytics tile on the Dashboard as an additional entity, with the access controlled through Privileges defined in Security Groups. This is a configurable option that can be turned On/Off. It allows you to gain insights by slicing and dicing data to generate reports quickly, so that you can take necessary action. Using this tile, you can:
- View reports created using power BI integration
- Create new reports using a selected Entity as required
- Control created reports through Security Group
- Ask a Question
As a User, you can:
- Access the Advanced Analytics Reports page directly on clicking the Advanced Analytics tile. This opens the Advanced Analytics page with the Analytics Reports tile selected and displaying self-generated and global reports.
- Access self-generated reports quickly from the My Reports section on the Advanced Analytics page.
- Access global reports from the Global Reports section of the Advanced Analytics page, if access is provided by the Administrator through Security Groups.
- Generate report based on different data models. For example, Agreement, Clause, Obligations & Fulfillments or Template. If ICI has only one dataset (for example, Agreement), then you will be taken directly to the Power BI user interface of the Agreement. However, if ICI has multiple datasets configured, then then you will be re-directed to the page where you can view a list of all the datasets in ICI. Clicking one of those datasets will direct you to the Power BI interface.
As an Administrator, you can:
- Save global reports as a separate entity and control access to such reports through Security Groups, either from the Security Groups tile or the Save Report window.
While creating reports, users with access to Power BI dashboards will now be able to see BusinessAppType filter in the agreement data model. Since the create report functionality is common to sourcing and contracting, using this filter allows users to create reports for either.
Using the BusinessAppType filter:
Go to Advanced Analytics > Create Report. Select a dataset, for example, Agreement. The BusinessAppType filter will be visible in the Agreement data type.
Note: Users will be able to see an application (such as Sourcing) in the filter only if it is enabled in ICI.
Viewing Existing Reports [edit]
To view reports:
1.Click the Advanced Analytics tile on the Dashboard. This opens the Advanced Analytics page.
2.Click a report that you created on the My Reports section. You can edit this report. For example, clicking the PowerBI_UserReport in the My Reports section opens it in Power BI as shown in the screenshot below.
3.Click a report on the Global Reports section to view a global report. Access to these reports is provided by the Administrator through Security Groups. For example, clicking the Power BI Report Contract Type in the Global Reports section opens it in Power BI as shown in the screenshot below.
Note: By hovering over a global report, you can view who has created it. If you are not a Primary Owner, you can only view a report but not edit it.
Creating Reports [edit]
To create a Report:
1. Click the Advanced Analytics tile on the Dashboard. This opens the Advanced Analytics page.
2. Click the Create Report tile. The available datasets will be displayed.
3. Click the desired dataset. For example, Agreement. The Power BI user interface opens.
4. In the FIELDS section, search or select from the available Agreements. For example, Agr_Agreement.
5. Select the options (from window on the right hand side) by which you want to create a personalized report. For example, Contract Type. Created By, and Expiry Date. The information or the customized report will be displayed in the main window.
Note: The Agreements, Clauses, Obligations & Fulfillments and Templates displayed in the Fields window are based on user authorization i.e. you can only see entities that you have permission to view.
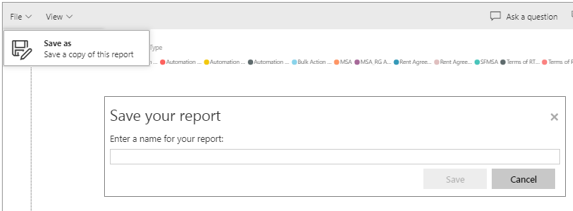
6. Click File > Save as to save and generate the report. A window opens so that you can enter a name for the report.
7. Name the report and click Save.
The saved report will appear in the Privileges section of theSecurity Group Details page. If you have Manage access to this report, then you will be able to view and access this report on the ICI user interface in the My Reports section of Advanced Analytics tile.
Asking a Question [edit]
To Ask a Question:
1. Click the Advanced Analytics tile on the Dashboard. This opens the Advanced Analytics page.
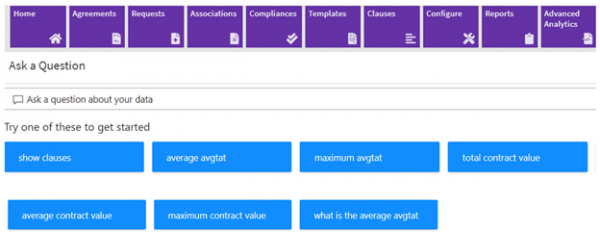
2. Click the Ask a Question tile. The available datasets will be displayed on the AskQuestion page.
3.Click the desired dataset. For example, Clause. The Power BI user interface opens.
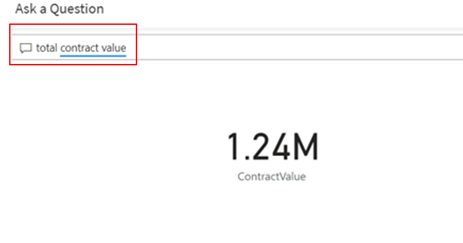
4. Click the Ask a Question tile to ask a question about your data. This is also a configurable option that can be turned On/Off.
5. You can now ask a question about your data for the selected dataset (that is Clause). Data related to the Clause will be displayed. For example, clause agreements, date hierarchy, etc.
6. Select the option that you want information about. For example, if you select clause agreements, the available Clause Agreements that you are authorized to view will be displayed in a drop-down menu filtered based on the type ahead functionality.
7. Select an option from the drop-down list. For example, clause agreements by Business Status Expired and Expiry Date. So, based on your question, the Expired Clause Agreements with their Expiry Date will be displayed.
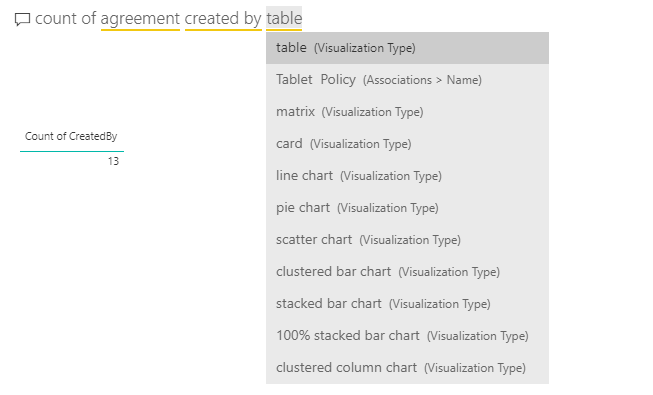
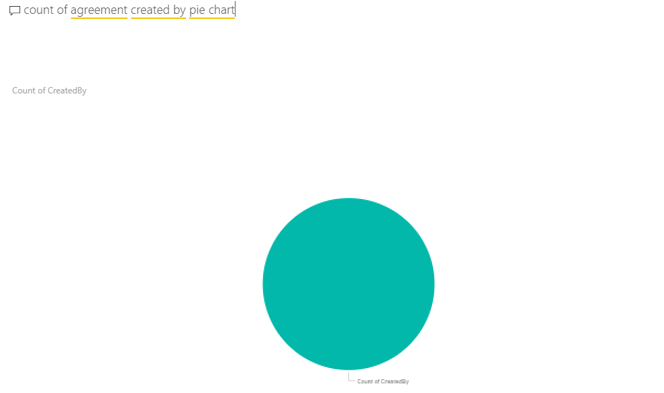
This displays the count at the bottom center of the window.
• You can also view the Agreements by pie chart, table, matrix, and so on.
Default Dashboards in Advanced Analytics[edit]
With the 7.9 release, in an effort to improve advanced analytics usability, additional functionalities have been added and some changes have been made.
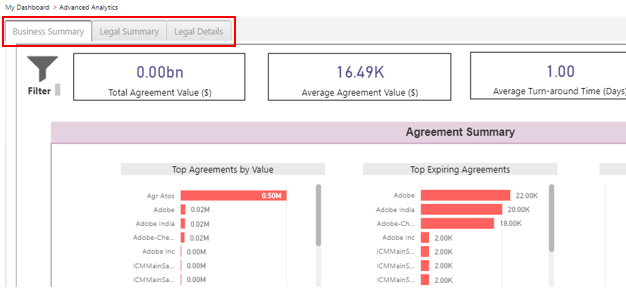
Default Dashboards are now available in the Advanced Analytics section. The Advanced Analytics tile now displays the following 3 tabs:
Business Summary[edit]
This displays the following charts based on the defined KPIs and the authorization of the user (for example, Finance Head):
- Agreement Summary such as Top Agreements by Value, Top Expiring Agreements, etc. (based on the defined KPIs).
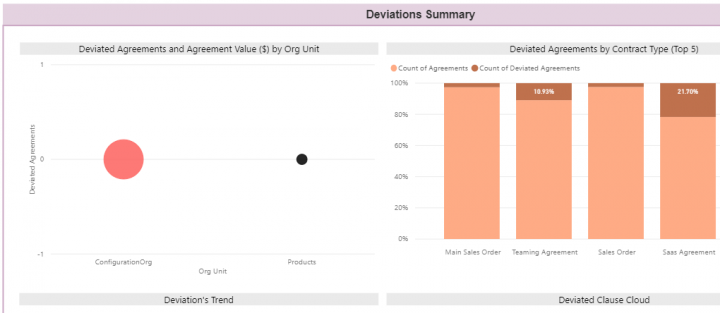
- Deviations Summary such as Deviated Agreements and Contract Value (s) by Org Unit, Deviated Agreements by Contract Type, etc.
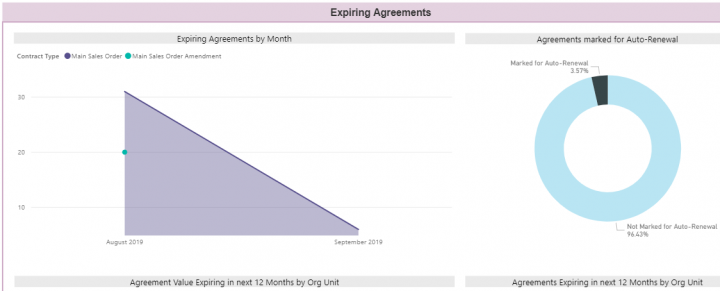
- Expiring Agreements such as Expiring Agreements by Month, Agreements marked for Auto-Renewal, etc.
- Cycle Time Report such as Cycle Time (in Days) by Contract Types, Trend of Cycle Time by Month, etc.
- Configuration Statistics such as Distribution of Templates by Contract Types, Clauses by Category, etc.
Legal Summary[edit]
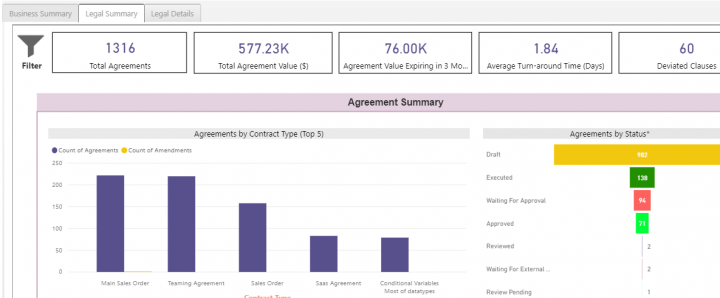
This displays the following charts based on the defined KPIs and the authorization of the user (for example, Legal Head):
- Agreement Summary such as Top Agreements by Value, Top Expiring Agreements, etc. (based on the defined KPIs).
- Deviations Summary such as Deviated Agreements and Agreement Value (s) by Org Unit, Deviations Trend, etc.
- Expiring Agreements such as Expiring Agreements by Month, Agreements Value Expiring in next 12 Months by Org Unit, etc.
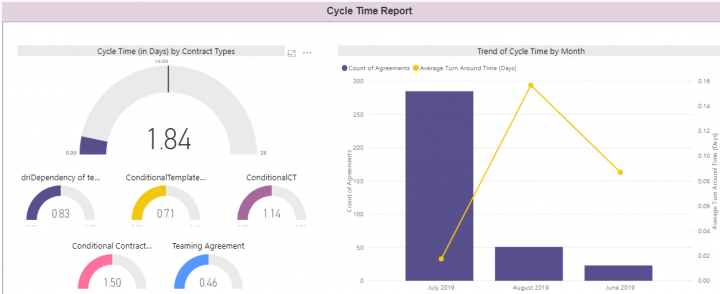
- Cycle Time Report such as Cycle Time (in Days) by Contract Types, Trend of Cycle Time by Month, etc.
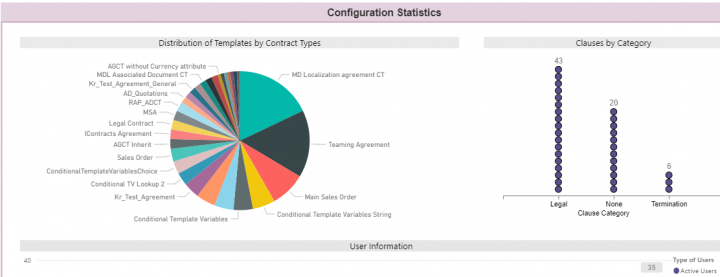
- Configuration Statistics such as Distribution of Templates by Contract Types, User Information, etc.
Legal Details[edit]
This displays the legal details at a more granular level based on the defined KPIs and the authorization of the user (for example, Legal Head):
- Agreement Summary such as Count of Agreements by Contract Type or Org Unit, Agreements by Status, etc. (based on the defined KPIs).
- Deviations Summary such as Deviated Agreements by Org Unit, Deviated Clause Cloud, etc.
- Expiring Agreements such as Expiring Agreements in 30 Days by their Org Unit, Agreements marked for Auto-Renewal in 30 Days by Org Unit, etc.
- Cycle Time Report such as Average Cycle Time (in Days) of Agreements, Month-wise Cycle Time Trend, etc.
Display User-level Information Charts
Legal managers will be able to view specific user-level data in a tabular format in the Agreement Summary, Deviation Summary and Expiring Agreements sections, and act on the insights gained from the reports.
- Agreement Summary (Wait Time Report): Legal managers can view the data of users and the cycle time for agreement approvals when the status of the agreement is Waiting for Approval, Waiting for External Signature or Waiting for Internal Signature. This will enable them to reach out to users and evaluate the reasons of agreement iterations, number of days in status and take measures to minimize the agreement cycle time.
- Deviation Summary (User Wise Deviation Report): Legal managers can get a quick view of the list of deviated clauses in agreements along with the total deviations and users that initiated the deviation. This will enable them to reach out to respective users and understand the context of the deviations.
- Expiring Agreements:
- Expiring in next 30 days: Legal managers can view the names of all owners for agreements that are expiring in the next 30 days. This provides them visibility into all upcoming agreements that are expiring so that appropriate actions can be taken. In addition, the Party Name and Agreement Value can also be viewed.
- Auto-renewing in next 30 days: Legal managers can view the names of all owners for agreements that are set to auto-renew in the next 30 days so that appropriate actions can be taken. In addition, the Party Name and Agreement Value can also be viewed.
Filter Data by the Agreement Status[edit]
Legal managers can filter the data in the Power BI dashboard by the Agreement Status – Executed, and display data only for agreements that match the filter criteria. This makes data analysis easier because only the data that meets the specified criteria is displayed while the others are hidden, thereby helping them make informed business decisions. However, for expiring and auto-renewing agreements, legal managers can filter the data in charts by both Executed and Superseded states.
Even though the filter changes apply to all the 3 Power BI dashboard tabs, Business Summary, Legal Summary and Legal Details tabs, it is restricted to the following charts:
Business Summary[edit]
Note: Since we are applying the Executed and Superseded filter to all charts except Total Agreement Value Pending Execution ($), the common filter Agreement Status at the page level is removed from the Business Summary dashboard.
Legal Summary[edit]
Legal Details[edit]
When creating reports, you can select which data model you want to use. For example, you can select Agreements data model to get agreement centric attributes and other data. If you select Clauses data model, then you would get clauses centric attributes and other data. The same applies using the Ask a question functionality.
The following UX related changes have been made:
- Last Updated On text is changed to Data Source updated successfully.
- The Refresh icon (which shows the minimum time of refresh cycle among all datasets) is changed to the Refresh page button.
- The Save your report option is now available for global reports. Users can save a copy of the report. It is visible in the user’s My Reports section and can be modified as required. If special characters are added to the report name, an error message will be displayed.
- You can change the name of the report using the Edit Report Name option. If special characters are added when renaming a report, an error message will be displayed.
- You can also delete this report using the Delete Report option if it is no longer relevant.
Related Topics: Reports | Agreement Details Page Reports | Legal and Compliance Reports | Admin Reports | Workflow Reports


