| Line 6: | Line 6: | ||
= Home = | = Home = | ||
| − | The Home page is | + | The Home page is the first screen you see when you log on to ICI. It presents a snapshot of your tasks and lets you access various features of ICI for which you have the privileges. |
| − | The dashboard layout provides | + | The dashboard layout provides a comprehensive look of business information on the Home page. The user experience especially around complex navigation has been enhanced and tasks can be performed with minimum number of clicks. Users can view their recent activities, saved searches, notifications and other information upfront on the dashboard, in addition to their list of tasks and KPIs/reports. |
<div class="image-green-border">[[File:Homepage 1.PNG|920px|Homepage 1.PNG]]</div> | <div class="image-green-border">[[File:Homepage 1.PNG|920px|Homepage 1.PNG]]</div> | ||
From the Home page you can: | From the Home page you can: | ||
| − | * | + | *Launch a feature you have access to by clicking on any of the tiles. |
| − | * | + | *Go to the "Details" page of a specific entity directly. Typing the first few letters of the entity name in the "Search" bar displays matching results in a chronological order. Click the required entity to view its "Details" page or navigate to the "Advanced Search" page by clicking the "View More" link. |
| − | *" | + | *"My Tasks" widget is available by default and it can neither be moved nor deleted. Tasks are specific actions that the logged in user needs to perform. These actions depend on the role of the user, type of task it is and the state the record is in. |
| − | + | | |
| − | + | == Dashboard Overview == | |
| − | + | ||
| − | + | *'''Performance Metric''': Displays all the KPIs to which the user has access. These include Saved Search KPIs and Report KPIs. | |
| − | + | *'''My Tasks''': Displays a list of tasks assigned to the user. The total number of tasks is displayed at the top of the widget, followed by the task link and the date on which each task was received. | |
| − | + | *'''Notification''': displays notifications in the descending order of the date and time in which they have been received. Clicking a notification navigates the user to the Notifications page. | |
| − | + | *'''My Recent Activities''': displays a list of the latest activities performed by the user on agreements, contract requests and clauses. The activities are displayed in the descending order (latest first, oldest last). | |
| + | *'''Saved Search''': Displays the searches saved on the "Search" page. | ||
| + | *'''What Would You Like To Do?''': Displays shortcuts to the most frequently performed actions by the user, for example, "Create Agreement", "View Agreement". | ||
Default Dashboard settings will depend on the settings implemented in your organization. | Default Dashboard settings will depend on the settings implemented in your organization. | ||
| Line 29: | Line 31: | ||
| | ||
| − | + | == Editing Dashboard == | |
| − | + | To edit the dashboard:<br/> '''Click''' "Edit Dashboard" button on the right-hand side of the page. The "Dashboard" switches to edit mode. | |
| + | <div class="image-green-border">[[File:Homepage 2.PNG|720px|Homepage 2.PNG]]</div> | ||
| + | In edit mode, you can: | ||
| − | + | *Resize widgets by clicking the resize icon | |
| + | *Move around and arrange widgets by double-clicking anywhere on the widgets | ||
| + | *Delete the widget by clicking the cross icon | ||
| + | <div class="image-green-border">[[File:Home-10.png|520px|Home-10.png]]</div> <div class="image-green-border"> | ||
| + | Administrators can configure personalized dashboards based on user groups and roles. Refer to [[Dashboard_Configuration|Dashboard Configuration]] for more details. | ||
| + | </div> <div class="image-green-border"> </div> | ||
| + | == Adding Widgets == | ||
| − | + | When the dashboard is in editing mode, '''click''' Add Widgets. The "Add Widgets" drawer opens. | |
| − | + | ||
| − | + | ||
| − | + | ||
| − | + | ||
| − | + | ||
| − | + | ||
| − | + | ||
| − | + | ||
| − | + | ||
| − | + | ||
| − | + | ||
| − | + | ||
| − | + | ||
| − | + | ||
| − | + | ||
| − | + | From the list of widgets, '''select''' the one you want to add to the Dashboard. For example, "All Agreements", "All Contract Requests", "Approved Sales Orders". A tick appears next to the selected list items. | |
| − | + | You can add up to 10 widgets. If you select 5 widgets, the "5 More widget(s) can be added" message is being displayed. If 10 widgets are added, then the "No more widgets can be added" message is displayed. | |
| − | + | '''Click''' "Add" button. The added widgets appear on the Home page. | |
| + | <div class="image-green-border">[[File:Homepage 3.png|720px|Homepage 3.png]]</div> | ||
| + | To arrange the widgets in the best possible way according to their sizes '''click''' the "Auto Arrange" button. | ||
| | ||
| − | == | + | == Widgets == |
| − | + | === What would you like to do? === | |
| − | *Ease of access to task level data | + | This quick links section has shortcuts for you to directly take actions, such as “Create Agreement”, “View Agreements” or even links to external sources. This enables organizations to keep the highest priority content front-and-center for all users. |
| − | * | + | |
| + | === My Recent Activities === | ||
| + | |||
| + | The “My Recent Activities” widget displays the signed-in user's recent activities. | ||
| + | |||
| + | === My Tasks / User Tasks === | ||
| + | |||
| + | The "My Tasks" widget on the Home page gives you: | ||
| + | |||
| + | *Ease of access to task level data | ||
| + | *Scope to drive tasks to timely closure | ||
*Improved user experience for better understanding of the task level data | *Improved user experience for better understanding of the task level data | ||
| − | + | ||
In ICI, tasks are generated for: | In ICI, tasks are generated for: | ||
| Line 78: | Line 85: | ||
*Contract Request Submitted | *Contract Request Submitted | ||
| − | The Administrator configures the SLA for the | + | The Administrator configures the SLA for the actions based on the contract type. |
| − | + | <div class="image-green-border">[[File:Home-5.PNG|820px|Home-5.PNG]]</div> | |
| − | The following columns are displayed | + | The following columns are displayed under User Tasks: |
*Task (for example, Approval, External Signature) | *Task (for example, Approval, External Signature) | ||
| Line 91: | Line 98: | ||
*Entity Created On | *Entity Created On | ||
| − | You can navigate to the | + | You can navigate to the entity by clicking the task. Each of the columns can be filtered and sorted. |
| − | + | === Adding Reports as KPIs === | |
| + | |||
| + | Reports can be added as KPIs by providing access through Security Groups. KPIs will give you a quick idea on progress of certain entities in and related to the agreement lifecycle. For example, the Signature Type Report KPI depicts the percentage of electronic signatures in ICI. If the number of electronic signatures is 6 and the number of manual signatures is 83, then the KPI is calculated as 6/83+6 = 6/89 (total number of agreements). Therefore, the percentage of electronic signatures displayed on the KPI tile on the Dashboard is 6 (rounded off to nearest digit). | ||
| + | |||
| + | The reports that are available KPIs on the Dashboard are: | ||
| + | |||
| + | *Agreement Deviation Report | ||
| + | *Agreements Pending Approval Report | ||
| + | *Agreements Pending Execution Report | ||
| + | *Approved Requests Waiting for Contract Creation Report | ||
| + | *Average Agreement Turn Around Time Report | ||
| + | *Clauses Pending Approval Report | ||
| + | *Expired Agreements Report | ||
| + | *Expiring Agreements Report | ||
| + | *Signature Type Report | ||
| + | *Templates Pending Approval Report | ||
| + | *User Login Report | ||
| + | |||
| + | The KPIs can be added to a user's dashboard in the editing mode by clicking "Add Widgets". | ||
=== Dashboard Smartlinks === | === Dashboard Smartlinks === | ||
| Line 117: | Line 142: | ||
*The “View More” link is available on smart link widget in the footer. | *The “View More” link is available on smart link widget in the footer. | ||
*The number of rows and columns will be displayed based on widget’s size. | *The number of rows and columns will be displayed based on widget’s size. | ||
| − | <div class="image-green-border"> | + | <div class="image-green-border">Saved Search widget is displayed after clicking the “Add Widget” button when editing the dashboard. </div> |
| − | + | ||
| − | + | ||
| − | Saved Search widget is displayed after clicking the “Add Widget” button when editing the dashboard. | + | |
| − | + | ||
Users can now have the saved search widgets displayed either as a tile with the computation configured on saved search like standard layout in classic view or in the view with list of records qualified in the saved search like widget layout in classic view. | Users can now have the saved search widgets displayed either as a tile with the computation configured on saved search like standard layout in classic view or in the view with list of records qualified in the saved search like widget layout in classic view. | ||
Revision as of 06:27, 8 February 2022
Contents
Home
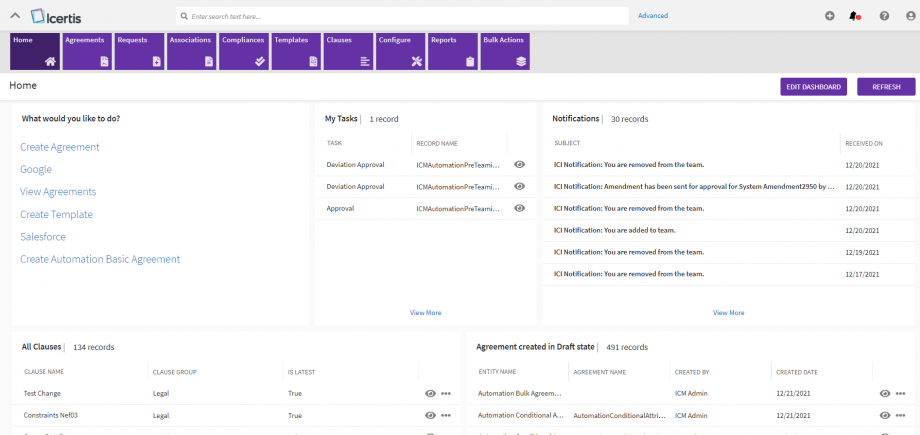
The Home page is the first screen you see when you log on to ICI. It presents a snapshot of your tasks and lets you access various features of ICI for which you have the privileges.
The dashboard layout provides a comprehensive look of business information on the Home page. The user experience especially around complex navigation has been enhanced and tasks can be performed with minimum number of clicks. Users can view their recent activities, saved searches, notifications and other information upfront on the dashboard, in addition to their list of tasks and KPIs/reports.
From the Home page you can:
- Launch a feature you have access to by clicking on any of the tiles.
- Go to the "Details" page of a specific entity directly. Typing the first few letters of the entity name in the "Search" bar displays matching results in a chronological order. Click the required entity to view its "Details" page or navigate to the "Advanced Search" page by clicking the "View More" link.
- "My Tasks" widget is available by default and it can neither be moved nor deleted. Tasks are specific actions that the logged in user needs to perform. These actions depend on the role of the user, type of task it is and the state the record is in.
Dashboard Overview
- Performance Metric: Displays all the KPIs to which the user has access. These include Saved Search KPIs and Report KPIs.
- My Tasks: Displays a list of tasks assigned to the user. The total number of tasks is displayed at the top of the widget, followed by the task link and the date on which each task was received.
- Notification: displays notifications in the descending order of the date and time in which they have been received. Clicking a notification navigates the user to the Notifications page.
- My Recent Activities: displays a list of the latest activities performed by the user on agreements, contract requests and clauses. The activities are displayed in the descending order (latest first, oldest last).
- Saved Search: Displays the searches saved on the "Search" page.
- What Would You Like To Do?: Displays shortcuts to the most frequently performed actions by the user, for example, "Create Agreement", "View Agreement".
Default Dashboard settings will depend on the settings implemented in your organization.
Editing Dashboard
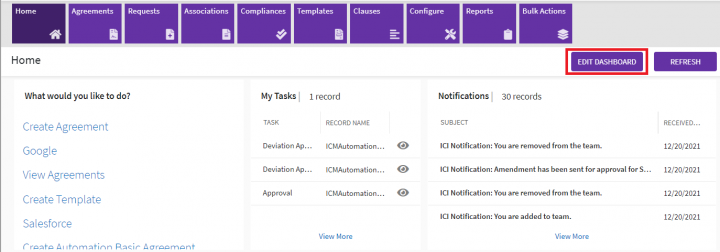
To edit the dashboard:
Click "Edit Dashboard" button on the right-hand side of the page. The "Dashboard" switches to edit mode.
In edit mode, you can:
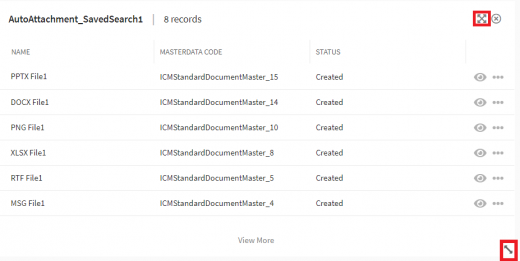
- Resize widgets by clicking the resize icon
- Move around and arrange widgets by double-clicking anywhere on the widgets
- Delete the widget by clicking the cross icon
Administrators can configure personalized dashboards based on user groups and roles. Refer to Dashboard Configuration for more details.
Adding Widgets
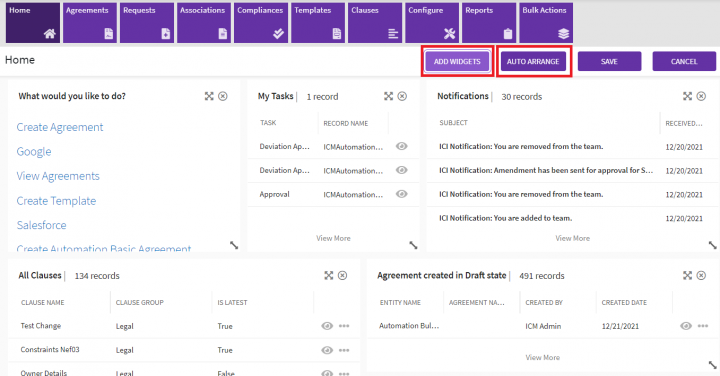
When the dashboard is in editing mode, click Add Widgets. The "Add Widgets" drawer opens.
From the list of widgets, select the one you want to add to the Dashboard. For example, "All Agreements", "All Contract Requests", "Approved Sales Orders". A tick appears next to the selected list items.
You can add up to 10 widgets. If you select 5 widgets, the "5 More widget(s) can be added" message is being displayed. If 10 widgets are added, then the "No more widgets can be added" message is displayed.
Click "Add" button. The added widgets appear on the Home page.
To arrange the widgets in the best possible way according to their sizes click the "Auto Arrange" button.
Widgets
What would you like to do?
This quick links section has shortcuts for you to directly take actions, such as “Create Agreement”, “View Agreements” or even links to external sources. This enables organizations to keep the highest priority content front-and-center for all users.
My Recent Activities
The “My Recent Activities” widget displays the signed-in user's recent activities.
My Tasks / User Tasks
The "My Tasks" widget on the Home page gives you:
- Ease of access to task level data
- Scope to drive tasks to timely closure
- Improved user experience for better understanding of the task level data
In ICI, tasks are generated for:
- Approval
- Deviation Approval
- Internal Signature
- External Signature
- Internal Review
- External Review
- Contract Request Submitted
The Administrator configures the SLA for the actions based on the contract type.
The following columns are displayed under User Tasks:
- Task (for example, Approval, External Signature)
- Entity Name
- Entity Code
- Entity Type
- Due By
- Primary Owner
- Task Created On
- Entity Created On
You can navigate to the entity by clicking the task. Each of the columns can be filtered and sorted.
Adding Reports as KPIs
Reports can be added as KPIs by providing access through Security Groups. KPIs will give you a quick idea on progress of certain entities in and related to the agreement lifecycle. For example, the Signature Type Report KPI depicts the percentage of electronic signatures in ICI. If the number of electronic signatures is 6 and the number of manual signatures is 83, then the KPI is calculated as 6/83+6 = 6/89 (total number of agreements). Therefore, the percentage of electronic signatures displayed on the KPI tile on the Dashboard is 6 (rounded off to nearest digit).
The reports that are available KPIs on the Dashboard are:
- Agreement Deviation Report
- Agreements Pending Approval Report
- Agreements Pending Execution Report
- Approved Requests Waiting for Contract Creation Report
- Average Agreement Turn Around Time Report
- Clauses Pending Approval Report
- Expired Agreements Report
- Expiring Agreements Report
- Signature Type Report
- Templates Pending Approval Report
- User Login Report
The KPIs can be added to a user's dashboard in the editing mode by clicking "Add Widgets".
Dashboard Smartlinks
Following enhancements have been made to Dashboard widget and tile.
- All smart links with below properties will be available to add as a widget:
- Global Search is enabled.
- Show on left pane option is enabled.
- Linked entity same as dashboard entity.
Note: The smart link widgets are not displayed for the main dashboard.
- Users can view the smart links as part of the dashboard widget.
- Users can view smart link data as part of dashboard as per the privileges assigned to the logged in user. If the Show on left pane option for smart link is not enabled, users will not be able to access the widget.
- The widget title of smart links contains the following options.
- Name: It is the name of saved search
- Count: It is the number of total records available for the smart link.
Note: In case user is not authorized for the smart link, the ‘Access Denied’ message will be shown
- Users can convert the smart link widget to a KPI tile.
- The “View More” link is available on smart link widget in the footer.
- The number of rows and columns will be displayed based on widget’s size.
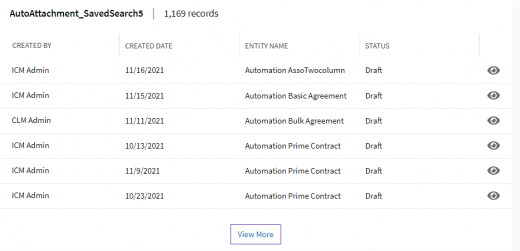
Users can now have the saved search widgets displayed either as a tile with the computation configured on saved search like standard layout in classic view or in the view with list of records qualified in the saved search like widget layout in classic view.
Users can now view the saved search data as part of dashboard saved search widget.
Saved Search with Security Group
Saved Search without Security Group
Saved Search with Organization Group access
Users can now view saved search data as part of dashboard saved search widget irrespective of KPI privileges.
- The widget title contains the following options.
- Name: It is the name of the saved search.
- Count: It is the number of total records available for the smart link.
- KPI: Are the key performance indicators created by the users.
- The widget title will be truncated based on the size of the widget, but the tool tip contains the complete information about the widget.
- The “View More” option is now displayed in the widget footer. Clicking this link navigates the user to the advanced search page by selecting the saved search data automatically.
Related Topics: Agreement Management | Associations | Compliances | Templates | Clauses | Configure | Reports | Advanced Analytics| Admin | ICI_Tools | AI Apps | ICI_Add-ins | Integrations | ICI_Mobile_App | ICI_BOT | Release_Notes | Advanced Search | Agreement Details | Notifications | | Bulk Actions |
