Contents
Reports Overview[edit]
ICM provides a number of out-of-the-box reports that have been strategically articulated to cater specific business needs. They provide an insight to different entities, states and progress of your Agreements, Clauses and Templates so that you can take necessary actions. They enable you make informed decisions by analyzing processes, cycle times, deviations, risks (expiry, renewal, actions pending, and so on.) and SLA’s at each level of an Agreement. Using the right filters to generate vital Reports provides clarity, allows you to correlate functionalities, and improve response time. Such information is valuable to the organization and has a positive impact on your business. It helps you identify future direction, improve performance, mitigate risk and increase revenue.
In ICM, Reports have been grouped based on their usage into Admin, Legal and Compliance, and Workflow for ease-of-use. You can view only those Reports that you are authorized to. You can either view all Reports together or you have the option to filter the reports based on the grouping, using the drop-down or the tabs. You can access individual Reports by clicking them and providing filters for each of them based on your specific requirement.
Reports are now enhanced to be displayed as per the language selected in the Locale Settings in the User Preferences. These reports are driven on the basis of user profile Language settings.
You also have the option to export the Reports to Excel, CSV or PDF formats.
Types of Reports[edit]
In this section, let us understand ICM Reports in detail.
Reports are mainly divided into 2 groups:
1. Default Reports: ICM provides a number of out-of-the-box Reports that have been strategically designed to cater to specific business needs. Although these Reports are default, the user will only be able to view the Reports that they are authorized to. Based on their usage, these Reports are displayed on the Agreement Details page or the Report tile.
2. Custom Reports: Customized Reports may be deployed in ICM based on the requirements of the customer by editing default reports or by creating entirely new custom reports or by deploying reports provided by the customer. These reports are customized for a customer based on their requirement.
Here is the list and a brief description of Reports in ICM.
- Detailed Report: This Report is Agreement specific and provides details of all the Associations of an Agreement entity-wise. It provides detailed view of all related entities to the Agreement such as, Commitments, Rules, History, and so on. It provides a complete view of the Agreement without the user having to navigate to multiple tabs for the same information. It is extremely convenient when the Agreement along with associations are required to be sent for offline reviews and audits. It helps to assess the accuracy of Associations. This helps in performing compliance checks to correct the outliers (where associations are not made).
- Attributes Value Report: Captures the values of the attributes and all the edits made to this over the lifecycle of the Contract till date. This Report actually replaces the earlier Export Attribute values on the Agreement entity.
- Clause Deviations Report: This Report is Agreement specific and provides a text comparison of the standard and the deviated Clause and highlights the difference between them for the specific Agreement from which it was accessed. It provides visibility into the Clauses that are deviated, by whom, the date and time, in what state, the approver and the approval date and time. It helps a legal person detect Clauses that get deviated frequently and make appropriate changes in the library to further reduce cycle times during contract negotiations.
- Expiring Agreements: Displays a list of executed Agreements that will expire in next 30,60 or 90 days.
- Agreement Deviation: Provides details related to Agreements that have registered deviations from the standard Clause language definitions in the library.
- Agreement Clause Content Report: Provides the Clause content (Clauses used in the Agreement Templates) for selecting a single or multiple Contract Type.
- Attribute Information Report: This is an existing Report Provides details of the attribute properties or metadata across its usage in different Contract Types.
- Expired Agreements Report: This is a new Report that displays all the contracts that expired in the last 30, 60 or 90 days.It helps you to make informed decisions on the renewals or terminations of contracts. The mapping of these Agreements with expiring Agreements helps make important revenue decisions.
- Average Agreement Turn Around Time: Provides information on the average number of days required for executing an Agreement or Amendment, from the date of its creation till the date of its execution.
- Clause Profiling Report: Helps in the mapping of Clauses to the corresponding Templates, with respect to the selected Contract Types. It helps application administrators to view the impact of a particular Clause on all the Templates that have the Clause added in the system. It displays the Clause, its corresponding version, and the Template details in which that Clause has been incorporated. The base entity for the Report is Clause. Even if the Clause does not have an associated Template, it would appear in the Report.
- Template Clause Report: Helps in the mapping Templates to the corresponding Clauses, with respect to the Contract Types. It helps application administrators to view the impact when a particular Clause or Template is changed in the system. It displays the Template, its corresponding version and the Clauses present in the respective Template. The base entity for this Report is the Template.
- Cycle Time Report: Shows the cycles for an Agreement and the change of states from the date of creation to the date of execution as well as the elapsed time. The purpose of this Report is to enable the user to detect the deficiencies in the processes and turnaround time for tasks. It helps in identifying the patterns that lead to longer cycle times and take corrective actions in the process and streamline it better.
- User Profiling Report: Helps you to find details associated to an individual user such as the role, groups and the associated entities. This enables the user to interpret the impact of the user on the system, impact of de-provisioning a user and so on. This Report helps analyze the critical actions pending for a user that may have a big impact. It also provides a direct link to the records and configuration modification that can help in curbing the impact. This Report can also a prerequisite to the Replace User functionality.
- User Login Report: Provides information of all user logins for a selected date range. It provides an insight on the adoption of the tool by providing details for the user as well as which function, unit and region is using the tool.
- Signature Type Report: Provides information on the percentage of Contracts that have been executed manually compared to electronically. Since this involves the entire ecosystem and is a time-consuming process, this Report provides visibility into the number of contracts that are signed manually against those signed electronically to facilitate compliance and adoption.
- Clauses Pending Approval: Provides information on the number of Clauses that are pending approval for an Agreement or Amendment along with the duration and the version.
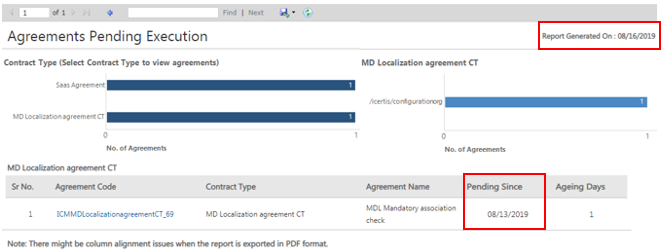
- Agreements Pending Execution: Yields data on the number of Agreements or Amendments that await internal signature and/or external signature, along with the duration and status changed date.
- Templates Pending Approval: Provides details related to Templates pending approvals, along with the duration and version.
- Agreements Pending Approval: Yields information on the number of Agreements or Amendments that are in the Waiting for Approval state.
- 'Approved Requests Waiting For Contract Creation': Provides a consolidated list of Requests for which the contract initiation has not begun.This Report enables the user the user to view all the actions that need to be taken and reduce chances of missing pending Requests to create Contracts. However, if the correct filters are applied for the Contract Type, date of request creation, approvals and request submission, this Report provides a consolidated list of Requests that are pending action. Without this Report, the user would need to apply the right filters in the Search field to get the desired outcome.
- CLM Activity Report: Provides a quick view for the CTOs, CFOs, etc. on the current high level status of the Agreements, Contract Requests and user activity to gauge the adoption of the ICM platform in their organization and take corrective action to increase adoption of the platform. The report can be filtered on the Frequency either Day Wise (default), Week Wise and Month Wise.
- Masterdata Information Report: Displays a summary of Masterdata and helps the user easily identify all the areas that will be affected or need to be modified by any change to the Masterdata Attribute values. The user can update and extract this detailed report on Masterdata and subsequently any reference of it in Rules, Contract Types, Contract Request, Masterdata, Agreements/ Amendments, Associations and User Groups where the given Masterdata Attribute value to make informed decisions. To access this report, users must have Configuration and Security group access.
Categories of Reports[edit]
Reports that are available on different tabs of the Reports tile are further categorized into three groups:
- Legal and Compliance
- Admin
- Workflow
Reports that are Agreement specific are available on the Agreement Details page.
Localization of Reports[edit]
To change the localization settings of a report:
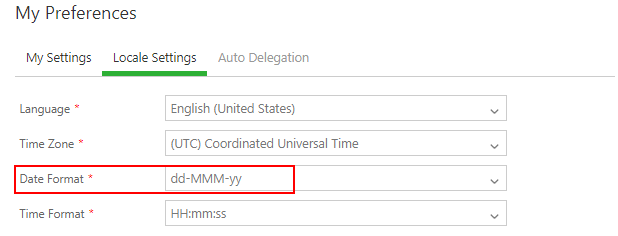
1. Select Preferences to view your preferences. The My Preferences window opens.
2. Click Locale Settings to view the options.
3. Select Language to choose a language that you would like to view the report in.
4. Select the Time Zone, Date Format and Time Format options for the drop-down list for the selected language.
5. Click Save to save your options.
6. Click the Reports tab.
7. Select the report that you want to view.
8. Click the chart to view the details of the selected report.
The report columns will be displayed based on the selected filters.
Displaying Date and Time as per User Preferences[edit]
Previously, all Date related columns and parameters in all ICM reports were displayed in the UTC Time Zone in the mm/dd/yyyy format. ICM allowed users to set the Date and Time format as per their preferred locale settings.
With this release, all reports will display the Date and Time as per the Time Zone set by the user in the user preferences.
However, the following points need to be noted:
- When reports are exported to CSV format, due to the inherent property of the CSVS files, the Date and Time format of the Date columns will be as per the user's local machine format, not as per the User Preferences set in ICM.
- In all reports, where the parameters to generate the reports have dates (for example, Created Start Date andCreated End Date in the Cycle Time Report), the default value in these fields are displayed in the UTC time zone. However, when the user changes values in these fields and generates the reports, the dates will then be displayed as per the user’s local time.
- If the Date Format selected in the user’s preferences is dd-mmm-yy, the date value in the field gets converted to the month & vice-versa. As a workaround, the date format in this field has been set as mmmm-dd-yyy, so that the default value is displayed as per the user’s expectations. However, the date format when the report is generated is displayed as per the user’s preferences. For example, if the user selects the Date Format as dd-MMM-yy in My Preferences, then the dates displayed in the Cycle Time Report fields Created Start Date and Created End Date are actually set as mmmm-dd-yy.
Adding Reports as KPIs[edit]
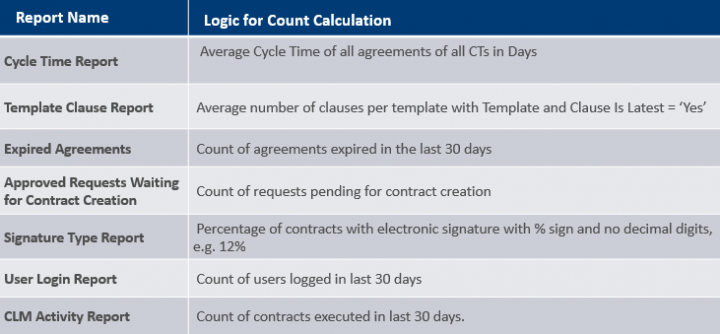
In addition to the reports that are already available on the Dashboard as KPIs (Agreement Deviation Report, Agreements Pending Approval Report, Agreements Pending Execution Reports, Average Agreement Turn Around Time Report, Clauses Pending Approval Report, Expiring Agreement Report, and Templates Pending Report), users can now also add the following reports:
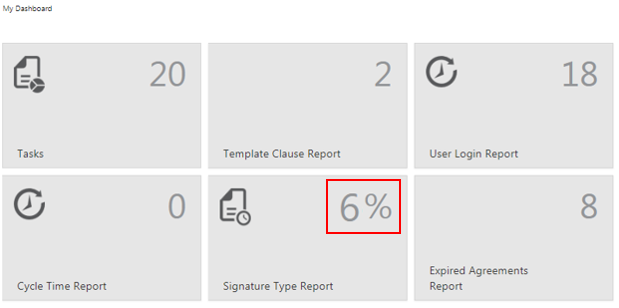
For example, the Signature Type Report KPI depicts the percentage of electronic signatures in ICM. If the number of electronic signatures is 6 and the number of manual signatures is 83, then the KPI is calculated as 6/83+6 = 6/89 (total number of agreements). Therefore, the percentage of electronic signatures displayed on the KPI tile on the Dashboard is 6 (rounded off to nearest digit).
Other reports that are available KPIs on the Dashboard include:
- Agreement Deviation Report
- Agreements Pending Approval Report
- Agreements Pending Execution Report
- Average Agreement Turn Around Time Report
- Clauses Pending Approval Report
- Expiring Agreements Report
- Templates Pending Approval Report
Related Topics: Agreement Management | Agreement Details Page Reports | Legal and Compliance Reports | Admin Reports | Workflow Reports | Power BI Integration with ICM


