From ICIHelp7.14
| (12 intermediate revisions by one other user not shown) | |||
| Line 1: | Line 1: | ||
| − | = | + | = Generating a Report = |
<font face="Segoe UI">Using the Reports feature you can generate various [[Types_of_Reports|types of reports]].</font> | <font face="Segoe UI">Using the Reports feature you can generate various [[Types_of_Reports|types of reports]].</font> | ||
| − | === <font face="Segoe UI">'''To generate a | + | === <font face="Segoe UI">'''To generate a Report:'''</font> === |
| − | + | #'''Click''' the ''Reports'' tile on ''My Dashboard''. You can view the default and custom reports. | |
| − | + | <div class="image-green-border">[[File:GenRep1.png|Default Report dropdown]]</div> <ol start="2"> | |
| − | #Click the Reports tile on | + | <li>'''Select''' an option from the ''Defaults Reports'' drop-down menu if you want to view ''All, Legal & Compliance, Admin or Workflow'' Reports. Selecting an option will display reports for the selected category below.</li> |
| − | + | </ol> | |
| − | + | <div class="image-green-border"> </div> <div class="image-green-border"> </div> <div class="image-green-border" style="margin-left: 40px;">3. '''Click''' the tile for the type of report you need to generate.</div> <div class="image-green-border" style="margin-left: 40px;">[[File:GenRep2.png|left|Default Reports Tiles]]</div> <div class="image-green-border" style="margin-left: 40px;"> </div> <div class="image-green-border" style="margin-left: 40px;"> </div> <div class="image-green-border" style="margin-left: 40px;"> </div> <div class="image-green-border" style="margin-left: 40px;"> </div> <div class="image-green-border" style="margin-left: 40px;"> </div> <div class="image-green-border" style="margin-left: 40px;"> </div> <div class="image-green-border" style="margin-left: 40px;"> </div> <div class="image-green-border" style="margin-left: 40px;"> </div> <div class="image-green-border" style="margin-left: 40px;"> </div> <div class="image-green-border" style="margin-left: 40px;"> </div> <div class="image-green-border" style="margin-left: 40px;">4. The report for the selected tile appears on a new tab. For example, selecting the ''Agreement Clause Content Report'' opens the report on a new tab displaying filters for the report.</div> <div class="image-green-border"> </div> <div class="image-green-border"> </div> <div class="image-green-border" style="margin-left: 40px;">5. On selecting the desired filters, '''click''' the ''View Report'' button to view the report.</div> <div class="image-green-border">[[File:GenRep4.png|View Report]]</div> <div class="image-green-border"> </div> <div class="image-green-border" style="margin-left: 40px;">6. Based on the permutations and combinations of the applied filter, the report is displayed with appropriate columns as shown in the figure below.</div> <div class="image-green-border">[[File:ReportExample.png|Report Example]]</div> <div class="image-green-border" style="margin-left: 40px;"> </div> <div class="note-box">'''Note:''' If you do not select a filter or apply incorrect filters, you see a message that filter parameters cannot be blank.</div> | |
| − | + | <font face="Segoe UI">You can now export the report into Excel, CSV or PDF or schedule and email to be triggered when it is generated.</font> | |
| − | + | ||
| − | + | ||
| − | <font face="Segoe UI">You can now export | + | |
| − | + | ||
| − | + | ||
Latest revision as of 08:27, 21 February 2018
Generating a Report
Using the Reports feature you can generate various types of reports.
To generate a Report:
- Click the Reports tile on My Dashboard. You can view the default and custom reports.
- Select an option from the Defaults Reports drop-down menu if you want to view All, Legal & Compliance, Admin or Workflow Reports. Selecting an option will display reports for the selected category below.
3. Click the tile for the type of report you need to generate.
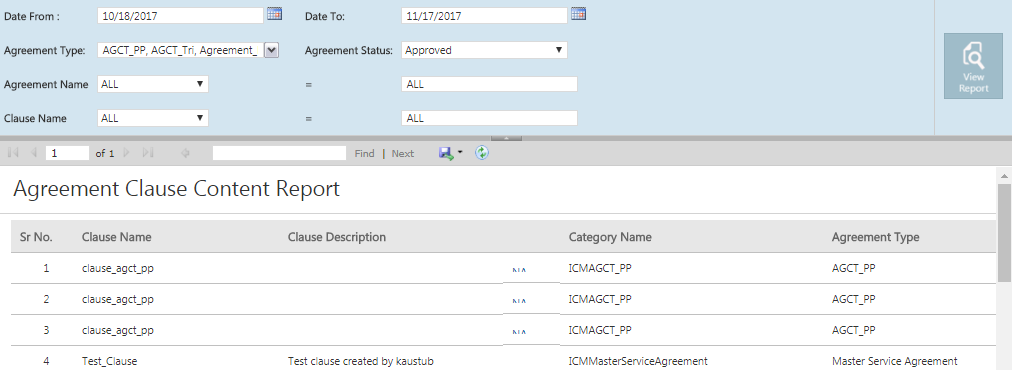
4. The report for the selected tile appears on a new tab. For example, selecting the Agreement Clause Content Report opens the report on a new tab displaying filters for the report.
5. On selecting the desired filters, click the View Report button to view the report.
6. Based on the permutations and combinations of the applied filter, the report is displayed with appropriate columns as shown in the figure below.
Note: If you do not select a filter or apply incorrect filters, you see a message that filter parameters cannot be blank.
You can now export the report into Excel, CSV or PDF or schedule and email to be triggered when it is generated.


