| Line 138: | Line 138: | ||
<div class="image-green-border">[[File:Reports Admin SignatureTypeReport img1.png|720px|Reports Admin SignatureTypeReport img1.png]]</div> <div class="image-green-border"> </div> <div class="image-green-border">[[File:Reports Admin SignatureTypeReports img2.png|720px|Reports Admin SignatureTypeReports img2.png]]</div> <div class="image-green-border"> </div> | <div class="image-green-border">[[File:Reports Admin SignatureTypeReport img1.png|720px|Reports Admin SignatureTypeReport img1.png]]</div> <div class="image-green-border"> </div> <div class="image-green-border">[[File:Reports Admin SignatureTypeReports img2.png|720px|Reports Admin SignatureTypeReports img2.png]]</div> <div class="image-green-border"> </div> | ||
| | ||
| + | |||
== CLM Activity Report == | == CLM Activity Report == | ||
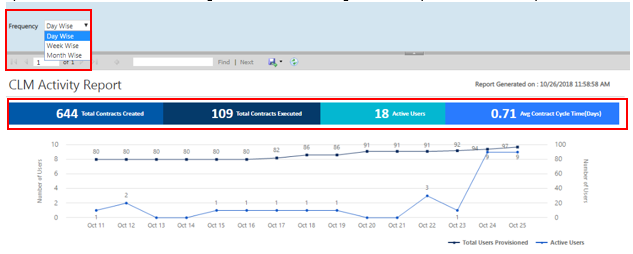
| − | <div class="image-green-border">This report gives a quick view for the CTOs, CFOs, etc. on the current high level status of the Agreements, Contract Requests and user activity to gauge the adoption of the ICM platform in their organization and take corrective action to increase adoption of the platform. The report can be filtered on the ''Frequency ''either ''Day Wise (default), Week Wise ''and ''Month Wis''e.</div> <div class="image-green-border"> </div> <div class="image-green-border">[[File:CLM | + | <div class="image-green-border">This report gives a quick view for the CTOs, CFOs, etc. on the current high level status of the Agreements, Contract Requests and user activity to gauge the adoption of the ICM platform in their organization and take corrective action to increase adoption of the platform. The report can be filtered on the ''Frequency ''either ''Day Wise (default), Week Wise ''and ''Month Wis''e.</div> <div class="image-green-border"> </div> <div class="image-green-border">[[File:7.12 CLM Activity Report.PNG|720px]]</div> <div class="image-green-border"> </div> <div class="image-green-border">This report is filtered on the ''Frequency'' either ''Day Wise, Week Wise ''and ''Month Wise''. By default, the ''Day Wise'' frequency is selected. <br/> On selecting the ''Day Wise ''option, the report displays the trend for the last 15 days (excluding the present day). However, for the ''Week Wise'', the report displays the trend for the last 12 weeks (excluding the present week) and the ''Month Wise'' option displays the trend for the last 12 months (excluding the present month). </div> <div class="image-green-border"> </div> <div class="image-green-border">Above this report, a ''Summary'' (cumulative numbers) since customer onboarding displays: </div> |
*''The Total Contracts Created'' | *''The Total Contracts Created'' | ||
*''The Total Contracts Executed'' | *''The Total Contracts Executed'' | ||
Revision as of 05:14, 31 July 2020
Contents
Admin Reports
The following reports belong to this category:
- Average Agreement Turn Around Time
- Clause Profiling Report
- Template-Clause Report
- Cycle Time Report
- User Profiling Report
- User Login Report
- Signature Type Report
- CLM Activity Report
- Masterdata Information Report
Average Agreement Turn Around Time
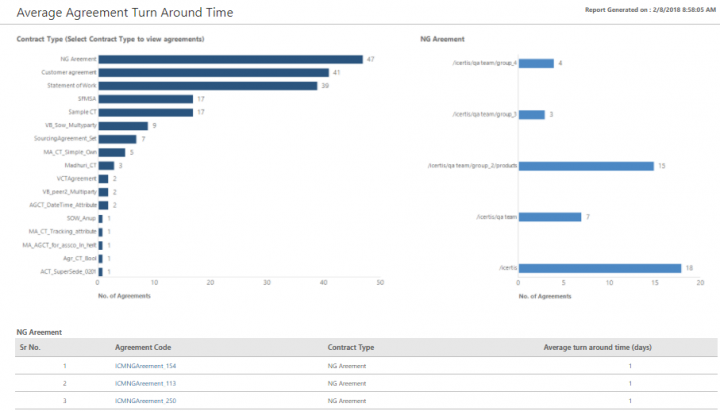
The Average Agreement Turn Around Time Report provides information on the average number of days required for executing an Agreement/Amendment, from the date of its creation till the date of its execution.
The report will only provide information that the user is authorized to view. The result displays a list of agreements for a Contract Type and provides details about the status changed date to be able to track the turnaround time. . The graphs summarize the average turn-around time for executing the Agreements along Contract Type and organization units.
The report displays the following columns with hyperlinks to the actual Agreement:
- Agreement Code, Contract Type, Average turn around time (days)
- Deviated By, Deviated Date andTime, Deviation Status, Comments Added By, Comments Added Date & Time, Comments, Approved By (multiple entries), or Approved Date & Time (multiple entries)
Clause Profiling Report
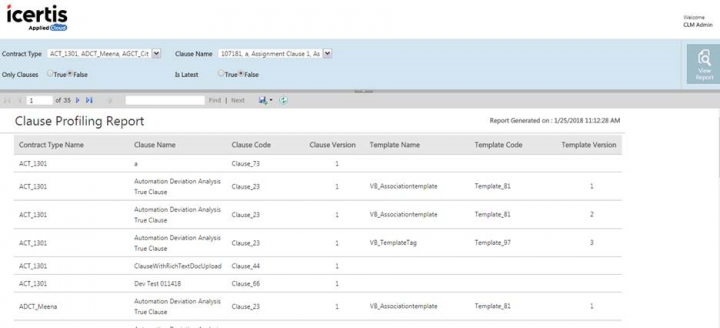
The Clause Profiling Report helps in the mapping of Clauses to the corresponding Templates, with respect to the selected Contract Types. It helps application administrators to view the impact of a particular Clause on all Templates that have the Clause added in the system. It displays the Clause, it’s corresponding version and the Template details in which that Clause has been incorporated. The base entity for the Report is Clause.
Even if the Clause does not have an associated Template, it must appear in the Report.
The filters to generate the report include Contract Type, Clause Name, Only Clauses and Is Latest. Contract Type and Clause Name are visible to the user based on their authorization.
If Only Clauses is set to True, only the Clause details are displayed in the Report; the Template details are not visible. However, if Only Clauses is set to False, then both the clauses and the respective template details are visible. The Default Value for this is False.
If Is Latest is set to True, only the latest version of the Clause will be displayed. However, if Is Latest is set to False, then all the versions of the Clause are displayed. The Default Value for this is False.
Based on the combinations of the applied filter, the following columns will be displayed with hyperlinks to the actual Agreement:
- Contract Type Name, Clause Name, Clause Code, Clause Version, Template Name, Template Code, and Template Version.
Template Clause Report
The Template Clause Report helps mapping Templates to the corresponding Clauses, with respect to the Contract Types. It helps application administrators to view the impact when a particular Clause or Template is changed in the system. It displays the Template, it’s corresponding version and the clauses present in the respective Template. The base entity for this Report is the Template.
The filters to generate the Report include Contract Type, Clause Name, Only Clauses and Is Latest. Contract Type and Clause Name are visible to the user based on their authorization.
If Only Templates is set to True, only the Template details are displayed in the Report; the Clause details are not visible. However, if Only Templates is set to False, then both the templates and the respective clause details are visible. The Default Value for this is False.
If Is Latest is set to True, only the latest version of the Template will be displayed. However, if Is Latest is set to False, then all the versions of the Template are displayed. The Default Value for this is False.
Based on the combinations of the applied filter, the following columns will be displayed with hyperlinks to the actual Agreement:
- Contract Type Name, Template Name, Template Code, Template Version, Clause Name, Clause Code, and Clause Version.
The report is sort by the alphabetical order of the Contract Type name followed by the alphabetical order of the Template name, followed by ascending order of Template version.
Cycle Time Report
The Cycle Time Report is a drill down report that shows the cycles for an Agreement and the change of status from the date of creation to the date of execution as well as the elapsed time. The purpose of this Report is to enable you detect the deficiencies in the processes and turnaround time for tasks. It helps you identify patterns that lead to longer cycle times and take corrective actions in the process and streamline it better.
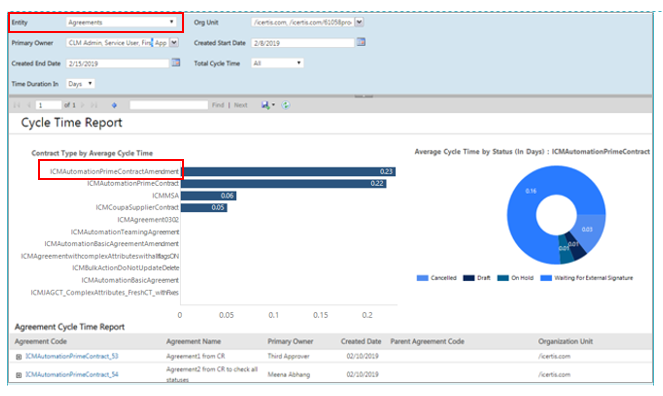
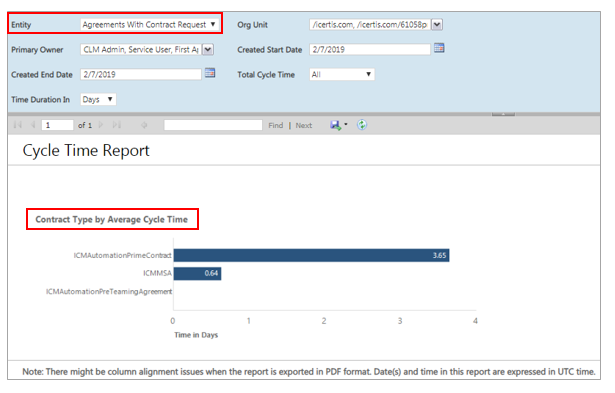
Reports can be filtered using the Entity field with the following values: Agreements, Agreements with Contract Request, and Contract Requests.
When the user selects Agreements:
- Amendments will also be displayed.
- An additional column Parent Agreement Code has been added to the tabular data that will display the parent Agreement of the Amendment.
When the user selects Agreements with Contract Request:
- A chart appears that displays the Contract Type by Average Cycle Time for all Agreements that have been created through Contract Requests. Clicking the Contract Type on this chart opens another chart that displays the Contract Requests by Status. The possible states include Waiting for Contract Creation, Draft, Waiting For Approval, Approved, Waiting For Internal Signature, Waiting For External Signature, On Hold, Cancelled, Contract Request Draft, Contract Request Waiting For Approval, Contract Request Approved, Waiting For Contract Creation, Contract Request On Hold, and Contract Request Cancelled.
- The following columns have been added to the tabular data – Contract Request Code, Contract Request Name, Contract Request Created Date, and Type of Agreement.
When the user selects Contract Requests:
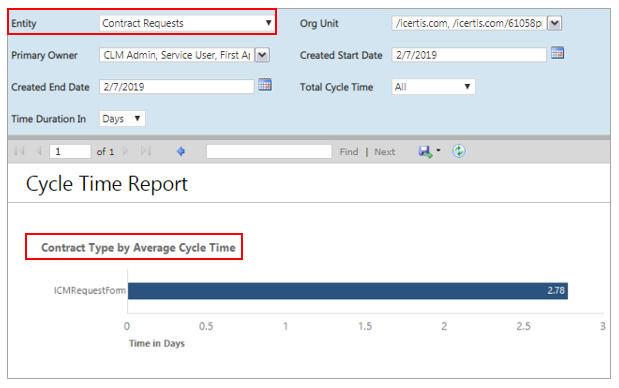
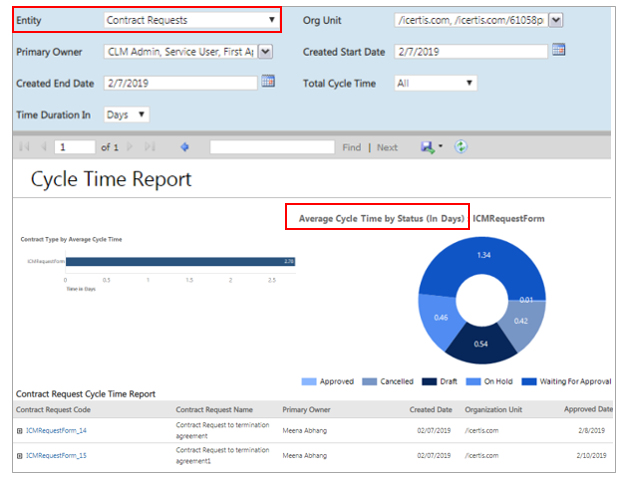
- A chart appears that displays the Contract Type by Average Cycle Time for all Contract Requests. Clicking the Contract Type on this chart opens another chart that displays the Contract Requests by Status (Draft, Waiting For Approval, and Approved).
Each time the Agreement returns to a previous state, a new entry is created. For example, If the approver is rejected and the Agreement comes back to the Draft state it is recalled from Waiting for External Signature state and so on. This is applicable only to executed Agreements. Each cycle is displayed as a new row when expanded. The excel export takes care of the relevant groupings and display all the data. This report displays charts. These charts help the user to easily compare the average cycle time for different contract types. They also help to easily identify the status in which Agreements remain for a longer duration.
The Bar graph on the left hand side displays the Contract Type by Average Cycle Time. By default, the report is filtered by Time Duration In Days, but you have the option to filter it by Hours as well. Clicking a bar on the graph displays the chart on the right hand side that displays the Average Cycle Time by Status of the Contract.
For example, the following two Agreements are displayed in the list: Agreement ICMMSA_SD (Total Duration – 3.87) and Agreement (Total Duration – 0.07). The bar on the chart displays an average of the total duration of these 2 reports i.e. 3.87+0.07/2 == 1.97
Clicking the bar on the Agreement ICMMSA_SD will display the Average Cycle Time Status (Approved, Draft, WaitingForApproval orWaitingForExternalSignature) chart for this Agreement in days on the right hand side.
The Report can be filtered on the Contract Type, total cycle time, the date range of creation as well as the duration in days/hours.
Based on the applied filter, the result provides details about the date of creation and execution, the duration of the report whether it is in the draft, approval, waiting for signature or executed state for an Agreement.
The following columns with hyperlinks to the actual Agreement will be displayed:
- Agreement Code, Agreement Name, Primary Owner, Created Date, OU, Execution Date, Total Duration (Days), Draft Duration (Days), Waiting for Approval Duration (Days), Approved Duration (Days), Waiting for Internal Signature Duration (Days), Waiting for External Signature Duration (Days), On Hold Duration (Days), and Cancelled Duration (Days).
User Profiling Report
The User Profiling Report helps you find details associated to an individual user such as the role, groups and the associated entities. This enables you to interpret the impact of the user on the system, the impact of deprovisioning a user, and so on. The Report helps to analyze the critical actions pending for a user that may have a big impact. It also provides a direct link to the records and configuration modification which can help curb the impact. It can also act as a prerequisite to the Replace User functionality.
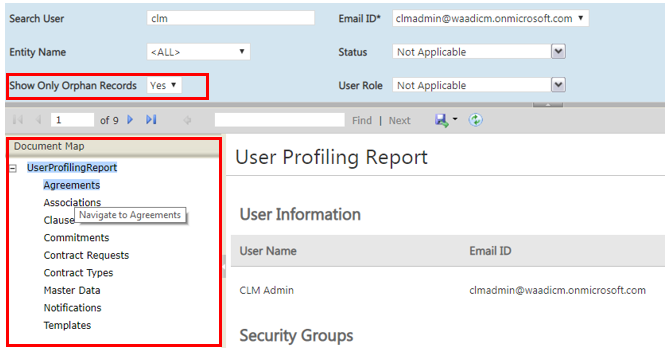
The report can be filtered by searching a user by name or email ID, the entity name or status or the role of the user and then clicking View Report which generates entities for the specified user name. This is followed by email ID, name of the entity and its status. You can also filter the Report by the role of the user.
Based on the applied filter, different set of columns will be displayed for each entity association type. The result includes details of the user including the name, email, associated groups, organization path and the roles assigned thus helping to identify critical actions related to the use.
The following columns will be displayed with hyperlinks to the actual Agreement:
- User Name, Email ID, Organization Unit Path, and Roles Assigned
When the flag Show Only Orphan Records is toggled to Yes, the records where the selected user is the only active (Primary/Secondary) user is displayed, so that you can easily identify the number of records that would get orphaned on de-provisioning the selected user. When the flag Show Only Orphan Records is toggled to No, all records where this user is part of the team, irrespective of the role, are displayed.
User Login Report
The User Login Report provides information of all user logins for a selected date range. It provides an insight on the adoption of the tool by providing details for the user as well as which function, unit and region is using the tool.
The possible filters to generate this report include the date range (by default current date minus 7 days) or the user name (as a type ahead or free text entry).
The result includes details such as the type of user, the login date and time, how long a user was active in the system, the IP address, and so on.
As a result, the following columns will display with hyperlinks to the actual Agreement:
- User Name, User Email Address, Organization Unit (path), Type Of User, Login Date and Time, and IP Address.
The IP Address column captures the IP address from all possible scenarios along with the Session Start Time.
The report is sorted by the alphabetical order of the user name first followed by the descending order of the login date.
Signature Type Report
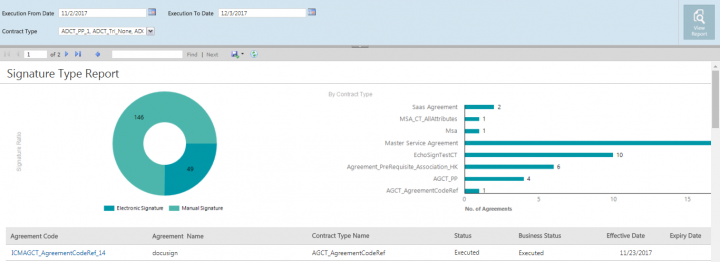
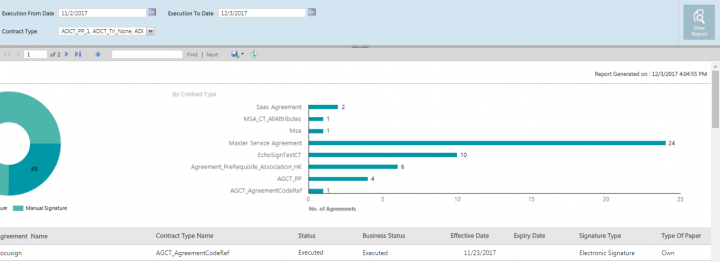
The Signature Type Report provides information on the percentage of Contracts that have been executed manually as compared to electronically. Electronic signatures have become popular as companies have started going green and minimizing the use of paper. Since this involves the entire ecosystem and is a time-consuming process, this Report provides visibility into the number of contracts that are signed manually against those signed electronically to facilitate compliance and adoption.
The filters to generate this report include the date range that helps to filter Agreements that moved to the Executed state for a Contract Type. inclusive of both dates. The results includes the Agreement details, its state, the effect and expiration date, the signature type, and so on.Multiple graphs may be seen based on the organizational units.
The following columns are displayed with hyperlinks to the actual Agreement:
- Agreement Code, Agreement Name, Contract Type Name, Status, Business Status, Effective Date, Expiry Date, Signature Type, and Type Of Paper.
The report is sort by alphabetical order of the Contract Type followed by the alphabetical order of Agreement code.
CLM Activity Report
On selecting the Day Wise option, the report displays the trend for the last 15 days (excluding the present day). However, for the Week Wise, the report displays the trend for the last 12 weeks (excluding the present week) and the Month Wise option displays the trend for the last 12 months (excluding the present month).
- The Total Contracts Created
- The Total Contracts Executed
- The number of Active Users
- The Average Contract Cycle Time (in Days)
- Total Users Provisioned (line graph)
- Active Users (line graph)
- Average Contract Turnaround Time (line graph)
- Contracts Created (bar chart)
- Contracts In Progress (bar chart)
- Contracts Executed (bar chart)
For example, in the report shown in the screenshot below, on Oct 23, 81 contracts were created in ICM. Apart from that, 366 contracts were in progress and only 9 contracts got executed on that date. The average contract turnaround time was 14 days on Oct 23.
3. The Contract Requests includes the following information:
- Average Contracts Turnaround Time (line graph)
- Total Contract Requests Approved (bar chart)
- Total Contract Requests Created (bar chart)
For example, in the report shown in the screenshot below, on Oct 19, 7 contract requests were created in ICM. Also, 1 contract request was approved and average contracts turnaround time was 1 day as of Oct 19.
Masterdata Information Report
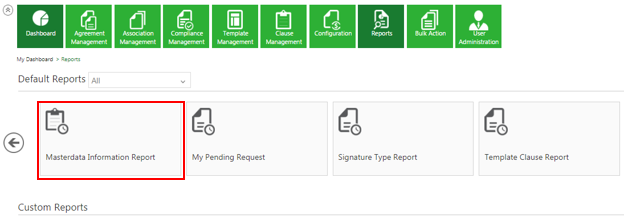
This report displays a summary of Masterdata and helps the user easily identify all the areas that will be affected or need to be modified by any change to the Masterdata Attribute values. The user can update and extract this detailed report on Masterdata and subsequently any reference of it in Rules, Contract Types, Contract Request, Masterdata, Agreements/ Amendments, Associations and User Groups where the given Masterdata Attribute value to make informed decisions. To access this report, users must have Configuration and Security group access. By default, the latest records are listed first but the list can be sorted as required.
For Contract types, all the Contract Type references where a particular Masterdata value (provided in the filter) is referred are displayed.
The records displayed will include:
- Attributes of any Contract Type that is configured as a conditional attribute on another attribute (Masterdata Lookup). For example, the attribute Discount may be configured as a conditional attribute that will be applicable if the attribute Project Value is more than $500,000.
- Any attribute of a Contract Type that is configured as a Lookup attribute and cascading is done on another attribute which is a Masterdata Lookup. For example, the attribute City (such as, New York) may be configured as a lookup and cascade on the attribute Country (such as, United States of America).
The report can be filtered using the following parameters:
- Contract Type
- Attribute Name
- Attribute Value
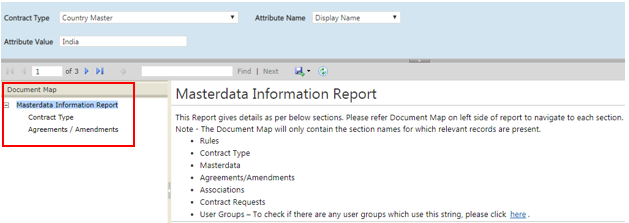
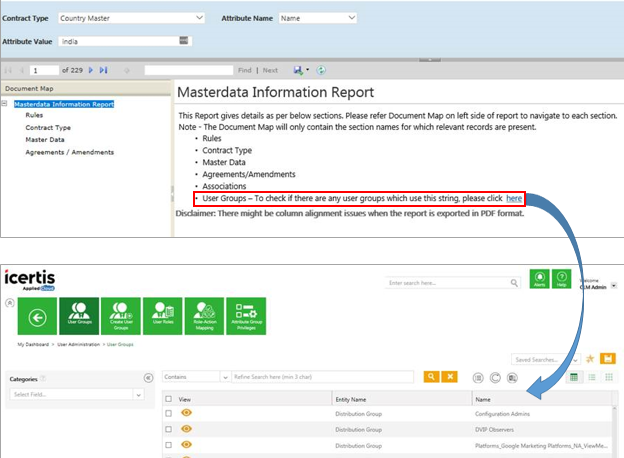
The Masterdata Information Report contains a Document Map on the left hand side that displays the only sections for which relevant records are present. Hyperlinks are provided for all the instances displayed in the report to easily navigate to the particular section.
The Contract Type section of the Masterdata Information Report can be filtered on the basis of the Contract Type and Attributes available for that Contract Type. Based on the applied filters, all the Contract Type references where a particular Masterdata value (provided in the filter) is referred are displayed. The records displayed will include:
- Attributes of any Contract Type that is configured as a conditional attribute of another attribute (Masterdata Lookup)
- Any attribute of a Contract Type that is configured as a Lookup attribute and cascading is done on another attribute which is a Masterdata
The following columns are displayed:
- Contract Type Name (hyperlink to the latest Contract Type Details page), Contract Type Code, Type of Contract, Contract Type Version, Attribute Name, Attribute System Name. Status
The Master Data section of the Masterdata Information Report can be filtered on the basis of the Contract Type and Attributes available for that Contract Type. Based on the applied filters, all the Masterdata instances where a particular Masterdata value (which is provided in the filter) is referred, with all instances that either Active or Inactive, are displayed.
The following columns are displayed:
- Contract Type, Masterdata Name, Masterdata Code (hyperlink to the Masterdata Details page), Attribute Name, Attribute System Name, Status
The Agreements/Amendments section of the Masterdata Information Report can be filtered on the basis of the Contract Type and Attributes available for that Contract Type. Based on the applied filters, all the Agreement and Amendment instances where a particular Masterdata value (provided in the filter) is referred (Attributes or Template Variables) are displayed. Legacy Agreements are displayed as well.
The following columns are displayed:
• Agreement Name (hyperlink to the Agreement Details page), Agreement Code, Attribute Name, Attribute System Name, 'S'tatus
The Associations section of the Masterdata Information Report can be filtered on the basis of the Contract Type and Attributes available for that Contract Type. Based on the applied filters, all the Association instances for Agreements and Amendments where a particular Masterdata value (provided in the filter) is referred are displayed.
The following columns are displayed:
• Association Name (hyperlink to the Association Details page), Association Type, Association Parent, Association Parent ID, Attribute Name. Attribute System Name, Status
The Contract Request section of the Masterdata Information Report can be filtered on the basis of the Contract Type and Attributes available for that Contract Type. Based on the applied filters, all the Contract Type Requests’ references where a particular Masterdata value (provided in the filter) is referred are displayed.
The following columns are displayed:
• Contract Request Name (hyperlink to the Contract Request Details page), Contract Request Code, Attribute Name, Attribute System Name, Status
The Rules section of the Master Information Report can be filtered on the basis of the Contract Type and attributes available in the Attributes Name drop-down for that Contract Type. Based on the applied filters, all the Rules where a particular Masterdata value (which is provided in the filter) is referred is displayed.
The following columns are displayed:
- Rule Name, Rule Type (hyperlink to the Rules Edit page), Rule For, Rule Description, Active, Last Updated, Contract Type, Rule, Condition, Action
A link to the User Groups is provided in the report that directs the user to the User Group page where you can manually verify if the particular Masterdata value (provided in the filter) is referred anywhere in the User Group.
Related Topics: Overview of Reports | Agreement Details Page Reports | Legal & Compliance Reports | Workflow Reports |
